Input data
1. Species
Five species are currently available for analysis:
- Homo sapiens (human)
- Mus musculus (mouse)
- Saccharomyces cerevisiae (yeast)
- Caenorhabditis elegans (nematode)
- Danio rerio (zebrafish)
2. ID type
The main gene identifier used in PECPI-GO is NCBI Gene ID (formerly Entrez ID). PECPI-GO also accepts yeast systematic name (abbreviation as YORF) and Affymetrix ID (hgu133 chip). Users need to select a gene ID type.
3. Experiment type
- Single dataset. For a single dataset, each gene corresponds to a normalized expression ratio (or in log2 scale) between the control (e.g. normal) and the experimental (e.g. disease) groups.
- Multiple dataset. For a multiple dataset, each gene corresponds to multiple normalized expression ratio from multiple time-courses or conditions of experiments. . (e.g., a time-course experiment for genome-wide gene expression profilings in drug-treated cells in 0, 2, 4, 8, and 12 hours).
- The gene expression data from microarray or RNA-seq must be normalized prior to analysis with PECPI-GO. Some normalization methods are suggested to deal with different sources of gene expression data:
- cDNA. Lowess
- Affymetrix. Limma
- RNA-seq. DESeq2 or EdgeR
4. Gene metrics
- Single dataset. For a single dataset, the metric of each gene can be the normalized expression ratio in log2 scale. The gene metric of -log10 P-value between the control and the experimental groups is not suggested, although it may be used appropriately in some case such as Affymetrix CEL data file format.
- Multiple dataset. For a multiple dataset, we define the metrics of each gene as the ratio of the maximal expression ratio to the minimal one across all the experimental conditions.
5. Input file
PECPI-GO accept only gene expression dataset in tab delimited file (.txt
file) format. The first row in the dataset should be a column header and PECPI-GO will
skip this row automatically. Please notice that the first row of data is ignored
if the input dataset does not contain a column header. The following rows
is gene with the corresponding expression value(s)
The first column should be the
gene identifier column and the remaining column(s) is the expression ratio correspond to
the gene ID in first column. Here are two examples input data for single dataset and
multiple dataset.

6. RNA-seq data
It is recommended to use some tools (such as DESeq2, EdgeR) to normalize RNA read counts dataset before applied the dataset to PECPI-GO. After normalizing, a gene list with log 2 ratio between samples can be directly used in PECPI-GO. If the normalized counts of each sample can be obtained in the normalization process, it can be applied to PPI interaction analysis to compute the correlation between control group and experiment group.
Parameters
- Input parameters
- Pathway enrichment analysis parameters
- Gene ontology annotation for pathway cluster
- Protein interaction analysis
| Parameters | Explanation |
|---|---|
| Random sampling size | The size of sampling for computing P-value of pathways in pathway enrichment analysis and P-value of edges that linked enriched pathways in pathway clustering. Increasing the sampling size will results in a more precise P-value, but it also increases the computation time and the usage of CPU and RAM. By default, the value is set at 100,000. |
| Max enriched pathway number | The maximum number of enriched pathways. Enriched pathway is removed iterately by pathway Q-value in descending order if the amount of enriched pathways is over the threshold until the amount of enriched pathways is equal to this value. |
| Show reactome pathway | Check the box to display Reactome pathway image in PECPI-GO when title of Reactome pathway is clicked. Otherwise, a webpage is opened and linked to the Reactome website to browse the pathway image and pathway details. Some Reactome pathway images have a large size and consume much of random-access memory (RAM) if display the image in PECPI-GO, thus it is not recommended to check the box without a sufficent RAM. By default the box is unchecked. |
| Parameters | Explanation |
|---|---|
| Q-value threshold | The threshold of Q-value (adjusted P-value) of pathway. Pathways with Q-value greater than this pre-defined threshold will be discarded. By default, the value is set to 1.0. |
| Coloring threshold | The theshold for coloring gene by expression of the gene. For example if the this value is set to 1.0, log2 ratio of a gene greater than 1.0 and less than -1.0 is shown in red color and l |
| Parameters | Explanation |
|---|---|
| Max frequency | Frequency of a GO term is defined as the number of gene annotated to a GO term divided by the total number of gene annotated to the entire ontology in the database. A general GO term has a higher frequency while a specific GO term has a lower frequency. GO term with frequency greater than this value (too general) is removed. By default, the value is set to 0.1. |
| Min NPL | The minimum normalized position level of a GO term. GO term with NPL less than this threshold (too general) is removed. By default, the value is set to 0.2. |
| Max NPL | The maximum normalized position level of a GO term. GO term with NPL greater than this threshold (too specific) is removed. By default, the value is set to 0.9. |
| Min SS | The minimum semantic similarity value to link GO terms and form a GO term network. By default, the value is set to 0.4. |
| Max annotation term | The maximum amount of GO terms to annotate each pathway cluster. Be default, the value is set to 5. |
| Parameters | Explanation |
|---|---|
| Correlation threshold | Threshold for linking genes (proteins) to form a protein network. By default the value is set to 0.6. |
| Max frequency | GO term with frequency greater than this value (too general) is removed. By default, the value is set to 0.1. |
| Min NPL | The minimum normalized position level of a GO term. GO term with NPL less than this threshold (too general) is removed. By default, the value is set to 0.2. |
| Max NPL | The maximum normalized position level of a GO term. GO term with NPL greater than this threshold (too specific) is removed. By default, the value is set to 0.9. |
| Min SS | The minimum semantic similarity value to link GO terms and form a GO term network. By default, the value is set to 0.4. |
| Max annotation term | The maximum amount of GO terms to annotate each pathway cluster. Be default, the value is set to 5. |
GUI manual
Pathway enrichment analysis
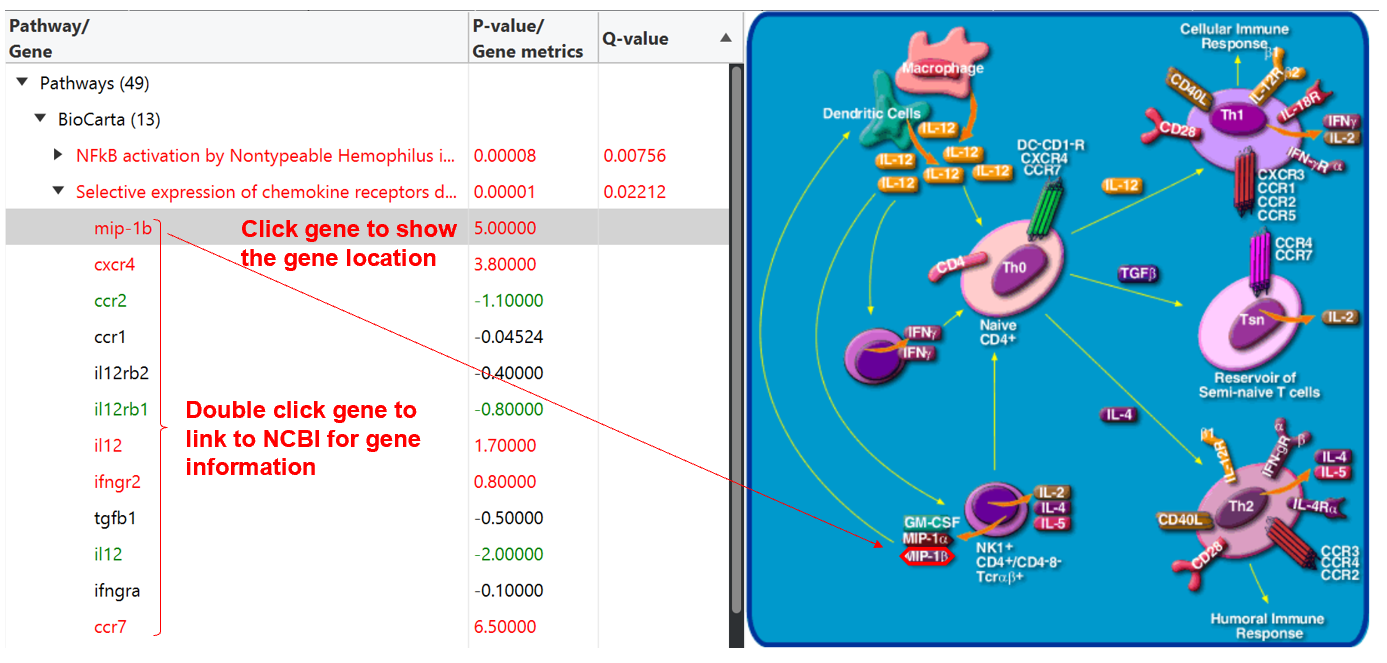
When pathway enrichment analysis is done, a new tab will be generated to easily visualize and explore these enriched pathways and their genes with expression abundance changes, which will be hierarchically displayed in left panel of the interface. By clicking one of these enriched pathways, its corresponding pathway map can be visualized in the right panel. Clicking on one of gene members in each pathway in the left panel can link to the gene’s position in the pathway map, and double click on gene will link to NCBI to browse the gene information.
Pathway clustering
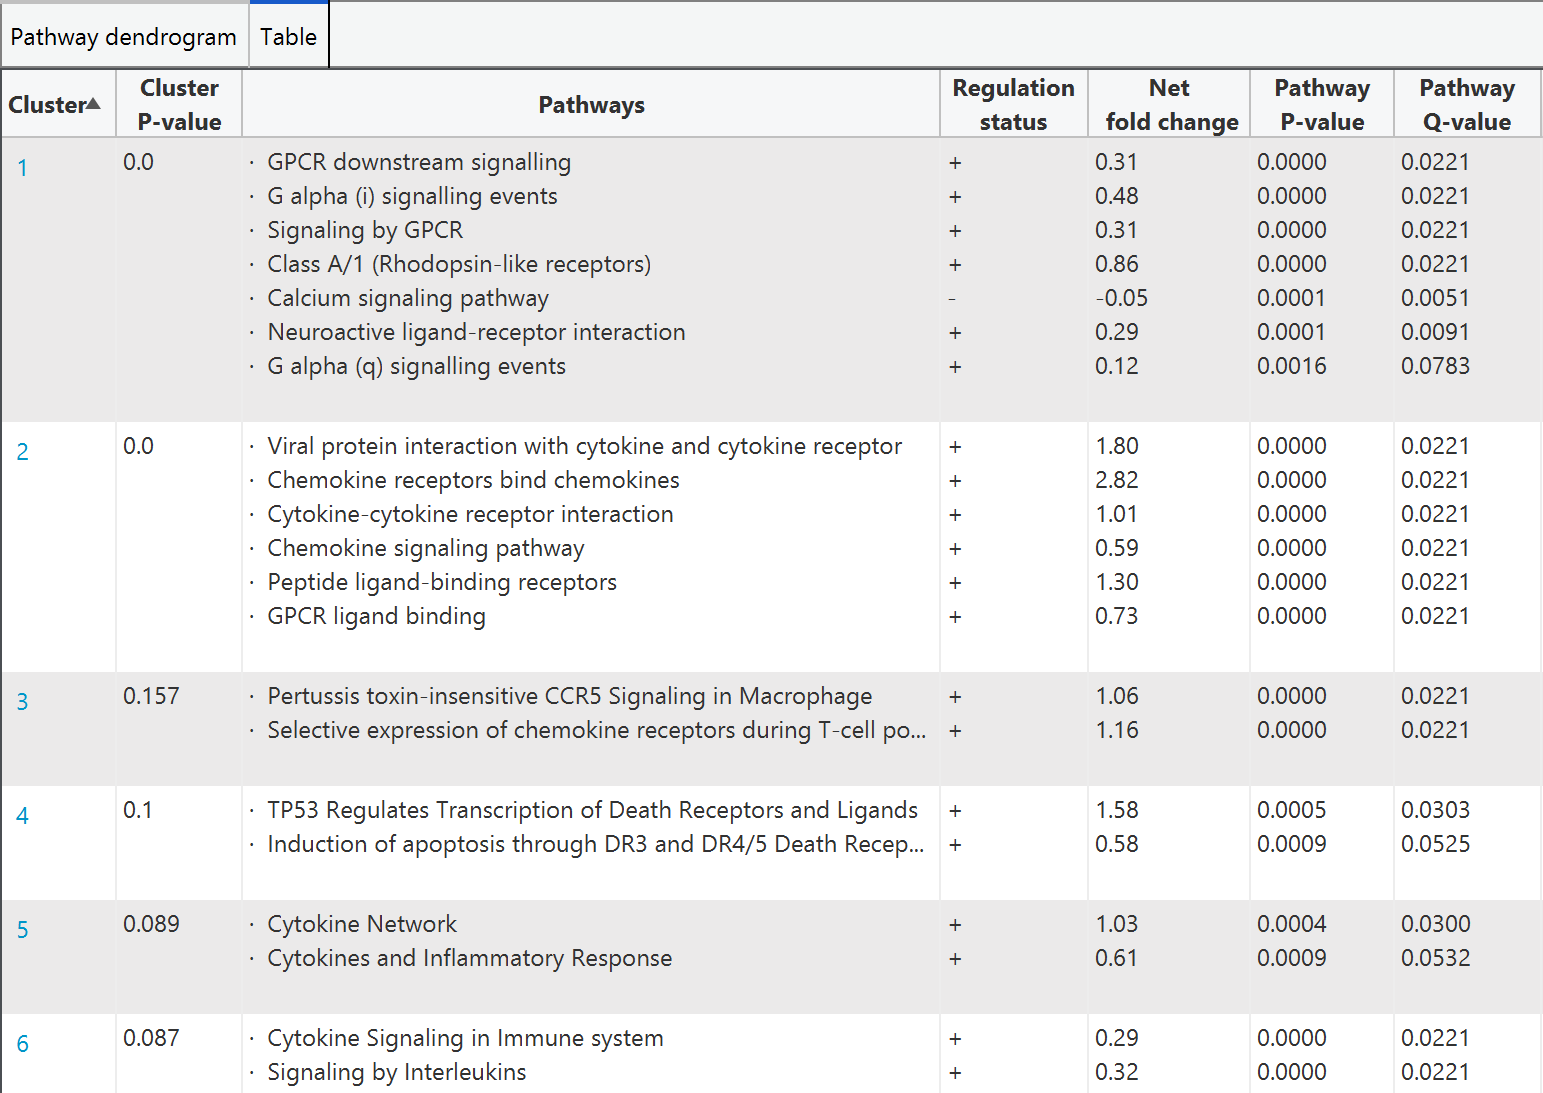
The tab 'pathway clustering' display the pathway clustering result both in graphical and tabular format to visualize the information of clustered pathways. A hierarchical tree is displayed in graphical format that each tree node represents a set of pathways and different pathway clusters are highlighted with different node colors (i.e., singleton pathways are colored as black)

For the tabular format, the pathways are grouped according to cluster result, with showing cluster P-value, pathway regulation status, net fold change, P-value, and Q-value are listed
Clicking on the colored node in tree or the cluster index in table will pop out another window for getting details of individual pathway cluster.
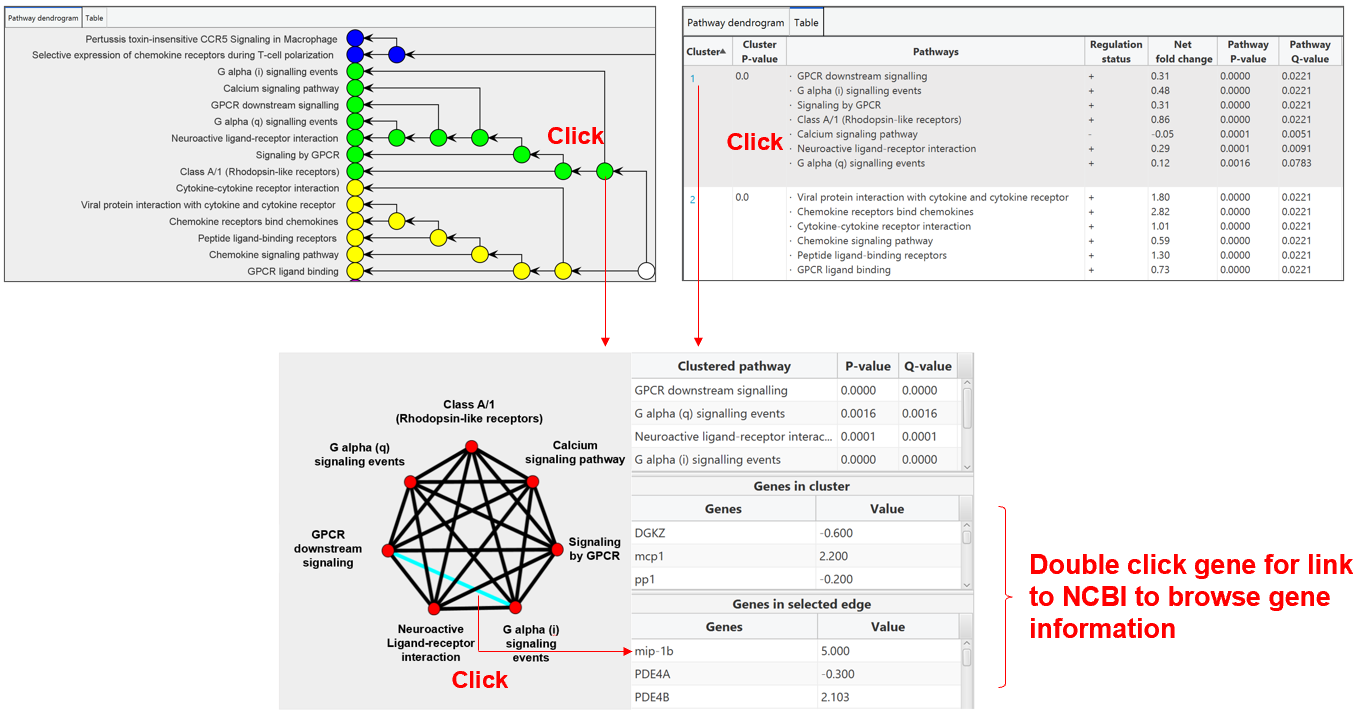
The left panel display the interacting network of a pathway cluster, where nodes represent pathways and edges represent the common genes overlapped between the two pathways. Clicking an edge in the network will indicate the common genes in the lower right panel. Double click the gene in the table can link to NCBI to browse the gene information.
GO term annotation to pathway clusters
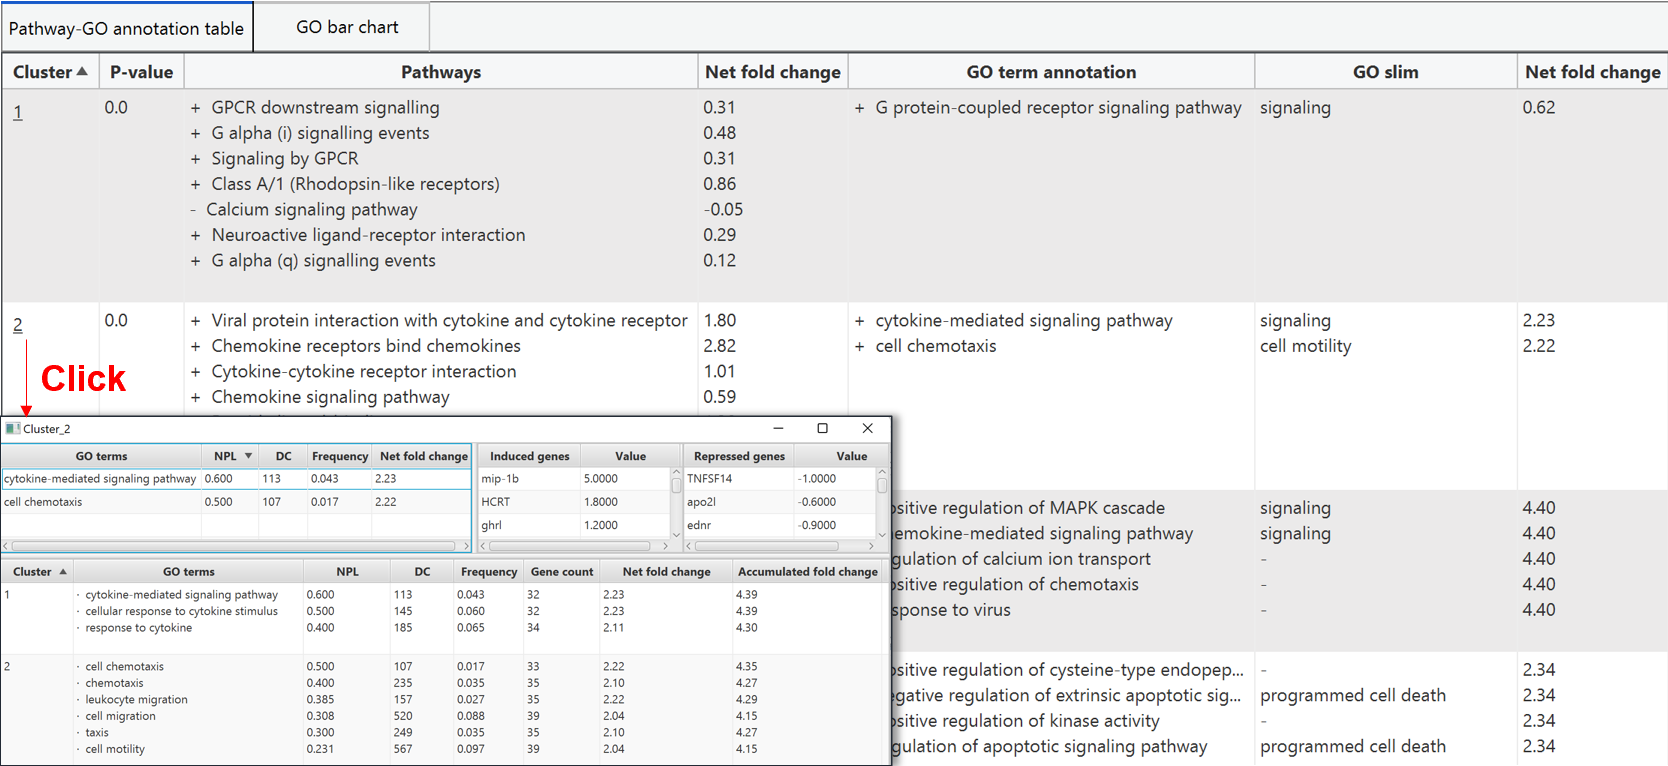
The GO term annotation to each pathway cluster is also presented in both tabular format and graphical format. In tabular format, the pathway cluster are listed with the GO term annotation and the correspond regulation status, net fold change, NPL, DC, and frequency. Clicking on the index of cluster in first column will pop out a new window for individual pathway cluster annotation.
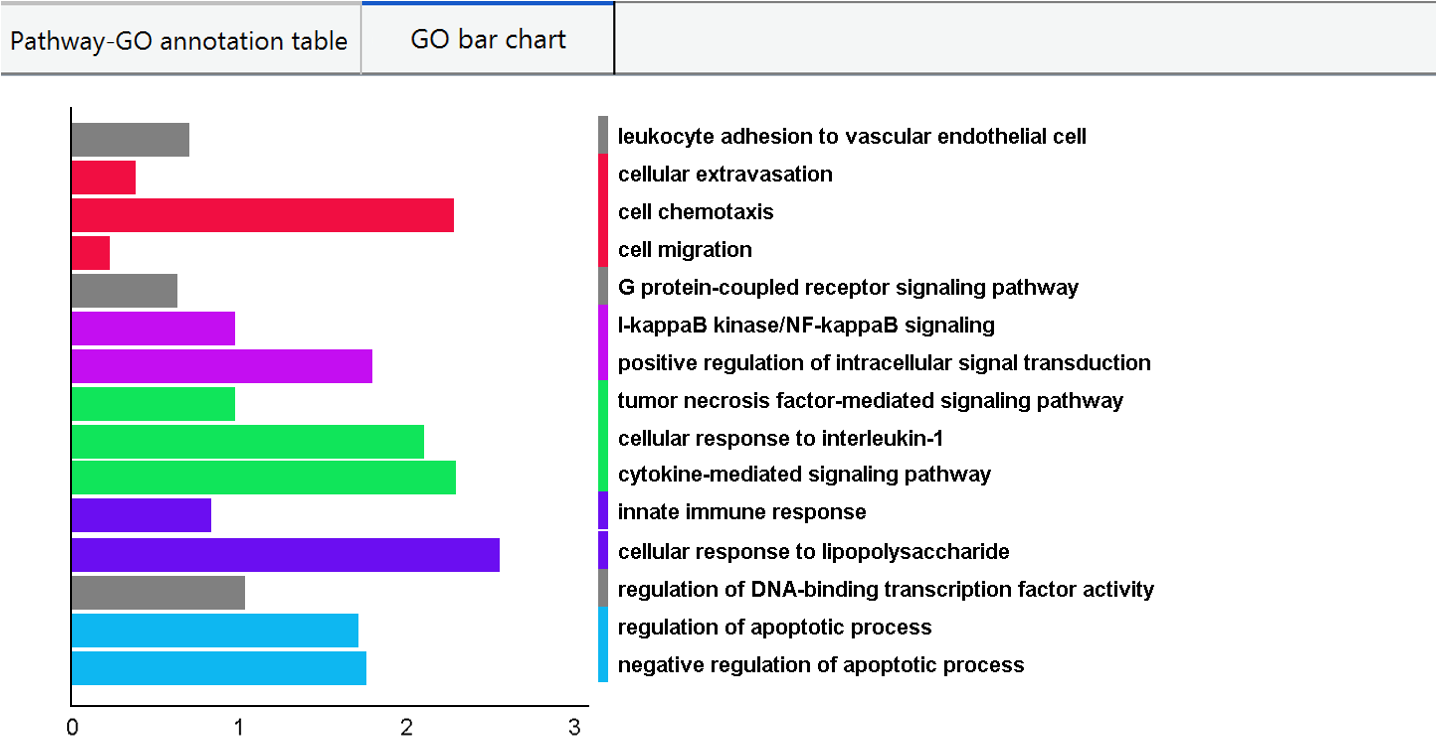
In graphical format, PECPI-GO hierarchically cluster GO terms with high similarity from all pathway clusters and visualize in a bar chart. The different GO clusters from hierarchical clustering are highligted with different bar color, and the bar is represented as the net fold change of GO term.
Protein-protein interaction (PPI) analysis
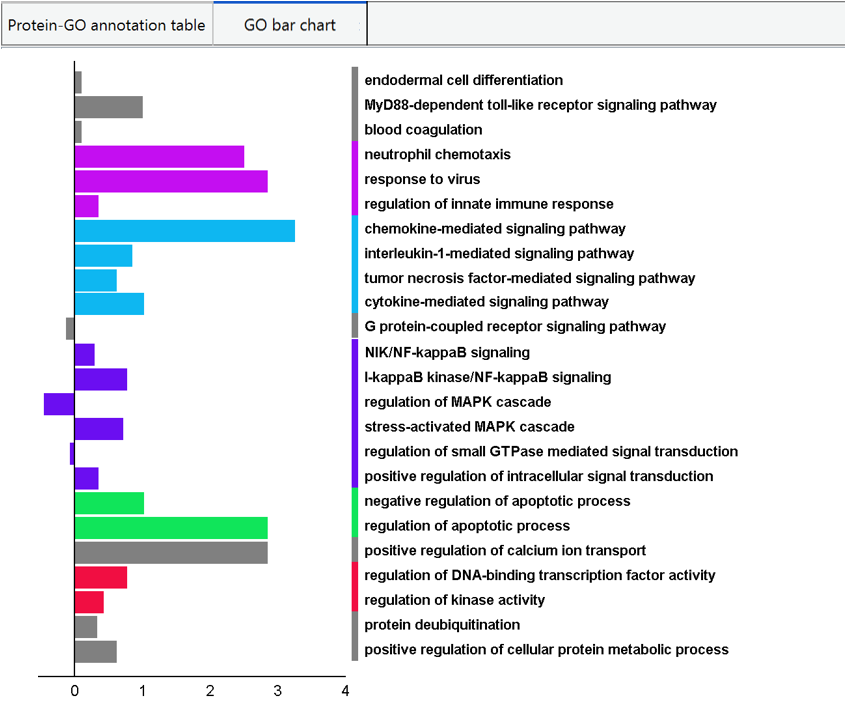
PECPI-GO treat the significant common genes as proteins and perform our novel clustering algorithm to clustering proteins. The presentation of the result is similar to pathway cluster annotation that in tabular format and graphical format.
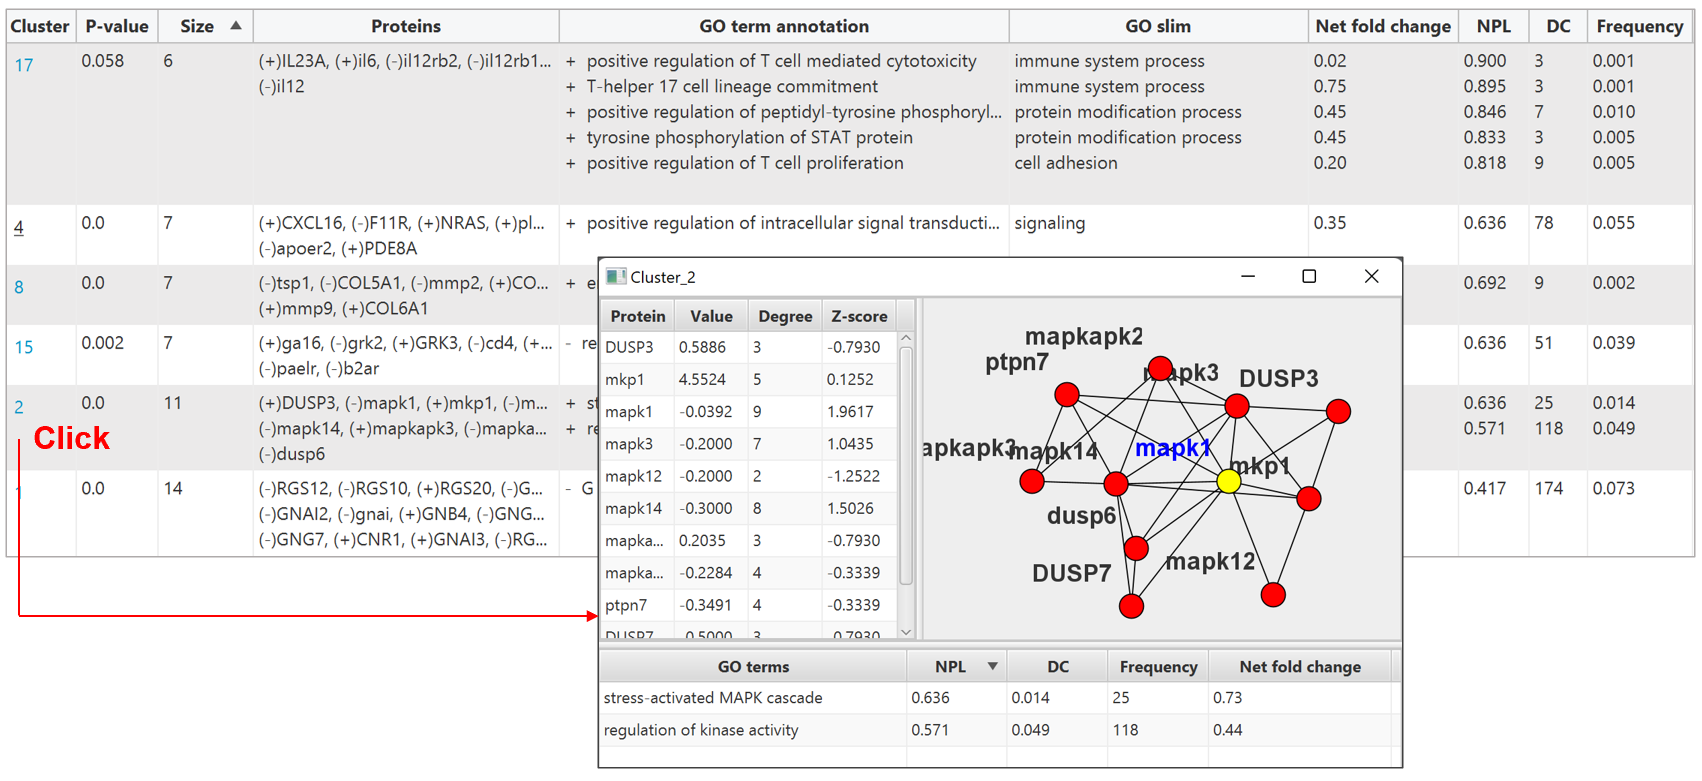
In the tabular format, click on the index of protein cluster in first column will pop out a
new window for individual protein cluster. The upper left panel is the proteins classified
in the cluster, with their degree and Z-score compute from the interaction network of the
subcluster (upper right panel). The lower panel is the GO terms selected to annotate the
protein cluster.
GO annotation integration
PECPI-GO integrate GO terms from pathway clusters and protein clusters to provided an overview of functional annotation. The integration can be either intersection or union of GO terms from pathway clusters and protein clusters. The result of the integration is visualized in graphical format and tabular format also.
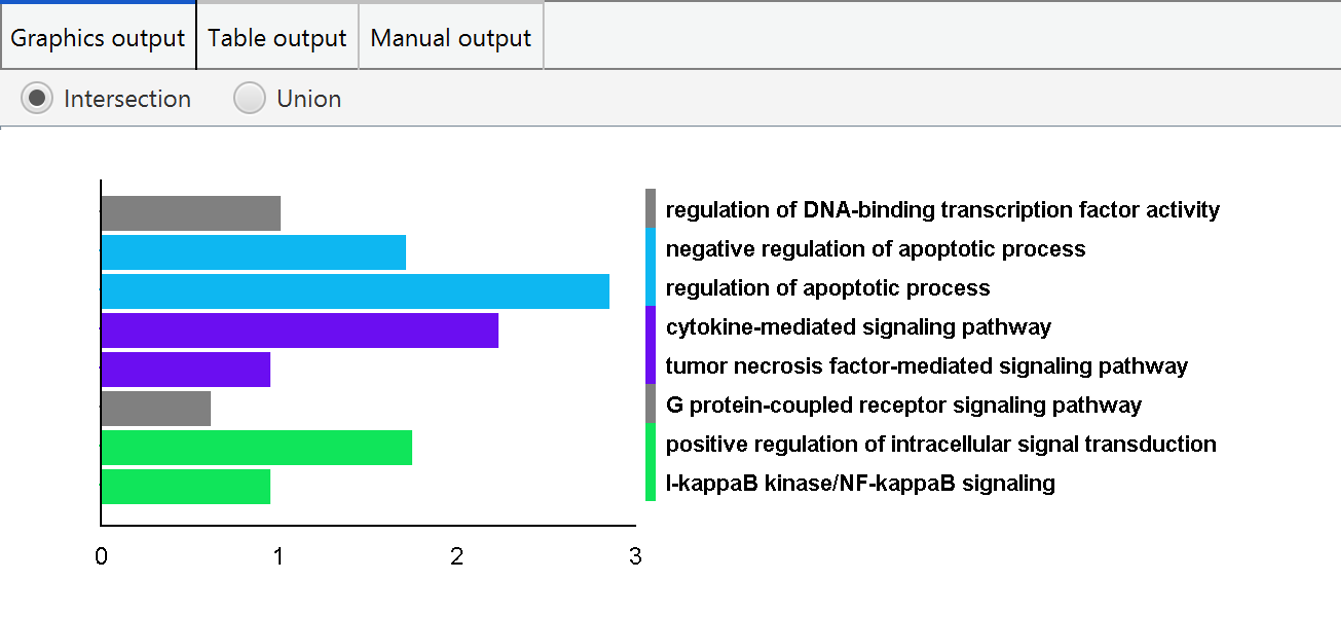
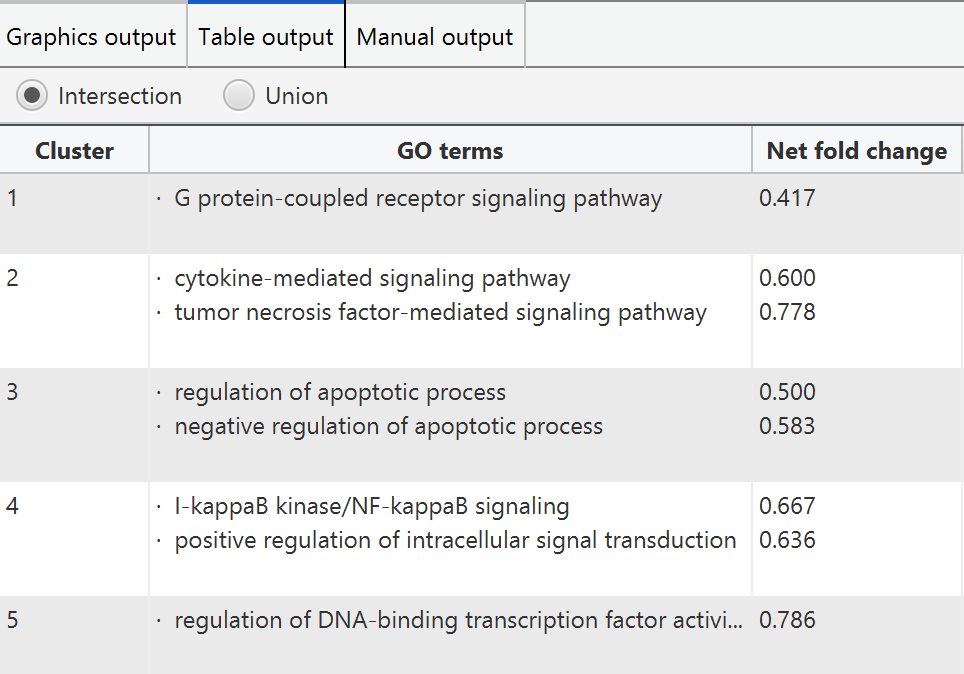
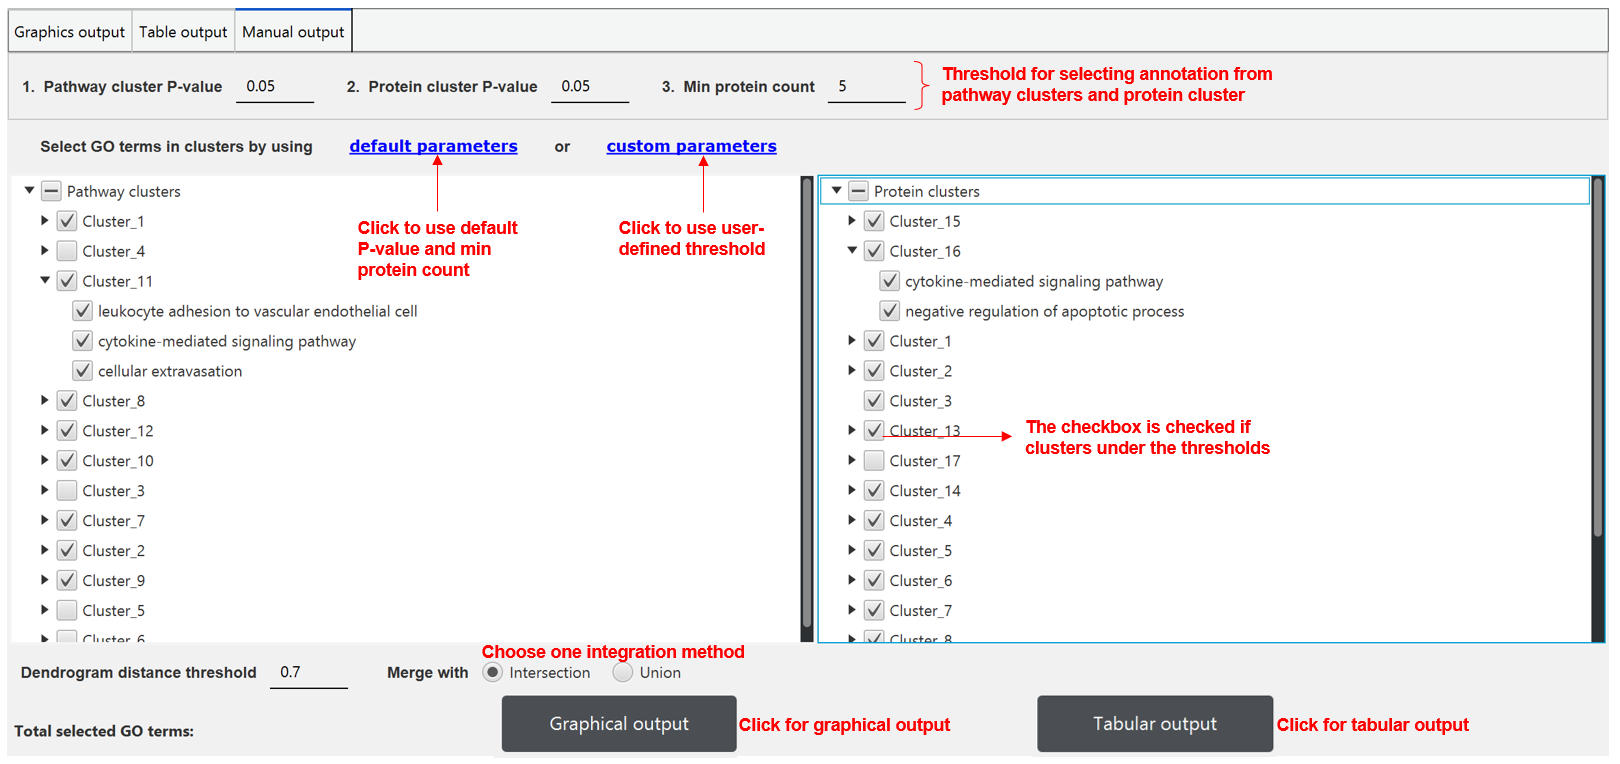
PECPI-GO provide users to manually select the appropriate GO terms based on their knowledge. In the tab 'manual output', users can change the P-value threshold for selecting pathway clusters and protein clusters. In addition, users can also set a threshold for minimum protein number in protein clusters.
